


Wastewater Treatment for an Ice Cream Factory
The Problem
One of the southeast’s largest ice cream processors was having a problem with excessive FOG (fats, oils and grease) in their effluent wastewater. The levels of FOG in their water were far above the county’s limits and were causing problems in the county’s lift stations. As a result, the county had given the plant a deadline of 6 months to fix the issue or face closure of the facility altogether. Furthermore, an odor problem had also lingered around the processor’s old wastewater treatment system because it had been undersized and overwhelmed with their high strength wastewater.
The Requirements
- The level of fats in the ice cream plant’s wastewater needed to be reduced to allowable standards mandated by the local county.
- The plant required assistance with the permitting of their new wastewater treatment system with the county authorities. Without the new permit, the plant would not be able to operate its new treatment system.
- Offensive odors produced by the biological treatment system also need to be eliminated.
The Solution
After consulting with Ecologix about the issues at hand, it was determined that an entirely new treatment system would be required to bring them into full compliance and solve all the problems associated with their wastewater. Ecologix would also provide full support in helping acquire the proper permits from the county to construct and operate this new treatment system.
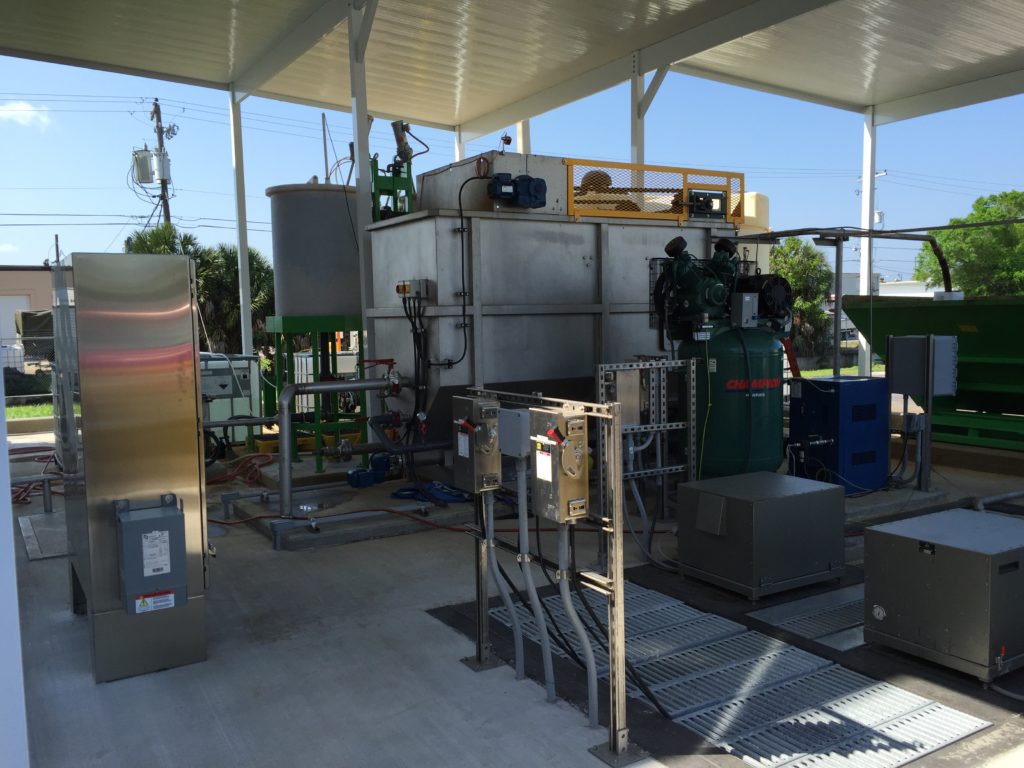
Ecologix designed and fabricated a state-of-the-art physical/chemical treatment system that included an equalization tank, continuous removal of free floating fats, chemical reaction tanks, a dissolved air flotation (DAF) system, and sludge dewatering. The entire system was designed and fabricated by Ecologix in house, as was the handling of the wastewater system permitting process for the client. The deadline set by the county was met and the creamery was operational within 6 months. The old failing system was demolished and replaced with a system that removes FOG and suspended solids, reduces biochemical oxygen demand (BOD), and eliminates offensive odors.
The Final Results
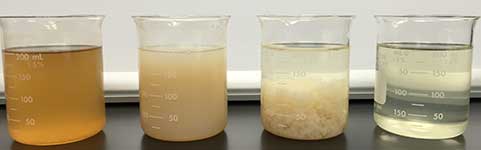
- FOG levels from the plant were reduced from an average of 1,290 mg/L to less than 10 mg/L.
- Total suspended solids (TSS) levels were reduced by over 99%
- Biochemical oxygen demand (BOD) was reduced by almost 45%.
Independent Lab Results
Initial (Pre-Treatment) influent composition results
| Test Method | Analyte Name | Result | Units | Det. Limit | Analysis Date |
|---|---|---|---|---|---|
| EPA160.2 | Total Suspended Solids | 1940 | mg/L | 2 | 2 Apr 2015 |
| EPA1664 | Oil & Grease | 1290 | mg/L | 3 | 7 Apr 2015 |
| EPA405.1 | Biological Oxygen Demand | 6190 | mg/L | 1 | 2 Apr 2015 |
| Test Method | Analyte Name | Result | Units | Det. Limit | Analysis Date |
|---|---|---|---|---|---|
| EPA160.2 | Total Suspended Solids | 6 | mg/L | 2 | 2 Apr 2015 |
| EPA1664 | Oil & Grease | 8 | mg/L | 3 | 7 Apr 2015 |
| EPA405.1 | Biological Oxygen Demand | 3560 | mg/L | 1 | 2 Apr 2015 |

If you are facing similar issues with your waste water treatment at your industrial or commercial plant, Contact Us Today to discuss your needs. You may be surprised how affordable a fully engineered solution may be! We have special expertise with all food related industries as well as most industrial wastewater problems.
Do you have a project you'd like assistance with?
Contact Ecologix Systems today for an engineered system quote specific to your requirements.